
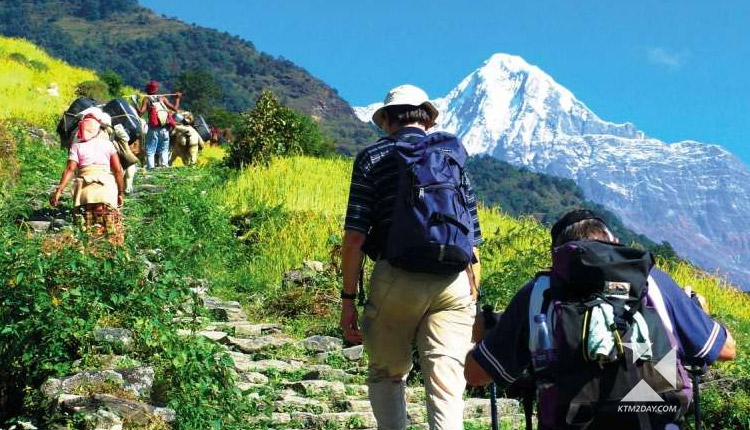
As a result of the Covid-19 pandemic, the country’s tourism industry is in decline. The tourism industry has recently been more active, and tourism-related activities have increased as well.
The influx of visitors serves as the most compelling evidence for this claim. Since the beginning of 2022, the number of foreign tourists has constantly increased.
A total of 58,348 international tourists entered Nepal in April, according to figures from the Nepal Tourism Board. According to data, this is 160 percent more than in the same month last year’s figures.
In the month of April, 52,663 tourists have left the country. Nepal was visited by 22,450 visitors in April 2021.
Tourist arrivals have decreased by more than half since 2019, according to data compiled by the board. Mani Lamichhane, director of the board, stated this year’s tourist growth rate was 160% higher than last year’s. According to the board 1,09,299 visitors arrived in April 2019.
There has been an increase in tourist arrivals this year. By the end of April, the number of tourists had increased by 53%. Lamichhane claimed the growth rate for the month of March was 45 percent.
In March of last year, there were 42,006 tourists that entered Nepal. Foreign tourists visited Nepal in record numbers in January and February, with 16,975 arriving in January and 19,766 arriving in the latter month.
There has been an increase in tourist traffic as a result of the board’s strategic marketing in the international resource market and the hard effort and diligence put in by entrepreneurs, according to Director Lamichhane.
| VISITORS ARRIVALs BY NATIONALITY ( air TIA ) | ||||
|---|---|---|---|---|
| Calendar Year: 2022 April VS 2021 April | ||||
| Country of Nationality | April | % Change | % Share April 2022 | |
| 2022 | 2021 | |||
| ASIA (SAARC) | ||||
| Bangladesh | 1,537 | 162 | 848.8% | 2.63% |
| India | 22,477 | 13,202 | 70.3% | 38.52% |
| Pakistan | 204 | 210 | -2.9% | 0.35% |
| Bhutan | 86 | 47 | 83.0% | 0.15% |
| Srilanka | 244 | 55 | 343.6% | 0.42% |
| Sub-Total | 24,548 | 13,676 | 79.5% | 42.07% |
| ASIA (OTHER) | ||||
| China | 281 | 803 | -65.0% | 0.48% |
| Japan | 320 | 107 | 199.1% | 0.55% |
| Malaysia | 420 | 44 | 854.5% | 0.72% |
| Singapore | 148 | 26 | 469.2% | 0.25% |
| S. Korea | 385 | 83 | 363.9% | 0.66% |
| Chinese Taipei | 23 | 8 | 187.5% | 0.04% |
| Myanmar | 48 | 58 | -17.2% | 0.08% |
| Thailand | 505 | 44 | 1047.7% | 0.87% |
| Sub-Total | 2,130 | 1,173 | 81.6% | 3.65% |
| EUROPE | ||||
| Austria | 291 | 47 | 519.10% | 0.50% |
| Belgium | 530 | 101 | 424.80% | 0.91% |
| Czech Republic | 382 | 52 | 634.60% | 0.65% |
| Denmark | 361 | 28 | 1189.30% | 0.62% |
| France | 1,922 | 161 | 1093.80% | 3.29% |
| Germany | 2,097 | 219 | 857.50% | 3.59% |
| Israel | 926 | 133 | 596.20% | 1.59% |
| Italy | 470 | 55 | 754.50% | 0.81% |
| The Netherlands | 786 | 136 | 477.90% | 1.35% |
| Norway | 152 | 21 | 623.80% | 0.26% |
| Poland | 521 | 174 | 199.40% | 0.89% |
| Russia | 953 | 685 | 39.10% | 1.63% |
| Switzerland | 498 | 107 | 365.40% | 0.85% |
| Spain | 891 | 103 | 765.00% | 1.53% |
| Sweden | 268 | 37 | 624.30% | 0.46% |
| U.K. | 5,252 | 540 | 872.60% | 9.00% |
| Sub-Total | 16,300 | 2,599 | 527.20% | 27.94% |
| OCEANIA | ||||
| Australia | 2,726 | 91 | 2895.60% | 4.67% |
| New Zealand | 98 | 12 | 716.70% | 0.17% |
| Sub-Total | 2,824 | 103 | 2641.70% | 4.84% |
| AMERICAS | ||||
| Canada | 1,028 | 185 | 455.70% | 1.76% |
| U.S.A. | 6,954 | 2,740 | 153.80% | 11.92% |
| Sub-Total | 7,982 | 2,925 | 172.90% | 13.68% |
| OTHERS | 4,564 | 1,974 | 131.20% | 7.82% |
| Total | 58,348 | 22,450 | 159.9% | 100.0% |
| Source: Immigration Department | ||||
| Analyzed & Compiled by: Nepal Tourism Board | ||||


")

")


")

