
Nepal’s foreign trade has seen notable improvement in the current fiscal year.
Between Shrawan 2081 and Jestha 2082 (July 2024 to May 2025), Nepal exported goods worth approximately Rs. 247 billion.
Although exports are still significantly lower than imports, there has been a consistent increase in exports over the past seven months. In the last four months alone, Nepal exported goods worth Rs. 121 billion.
According to the Department of Customs, this is a strong recovery from nearly two and a half years of declining import-export trade.
Historically, Nepal’s exports have not crossed Rs. 200 billion annually. The previous highest was Rs. 200.3 billion in FY 2078/79 (2021/22). But within just 11 months of the current fiscal year, Nepal has already surpassed that, reaching Rs. 247 billion, marking a 77% increase compared to last year.
This level of export growth has not been seen in any previous fiscal year. Based on available data, the last major increases were during FY 2031/32 and 2040/41, when exports grew by 50% and 60%, respectively.
From Shrawan to Ashoj (first 3 months), exports stood at Rs. 38.37 billion, which was 6.11% lower than the same period last year. However, in the following eight months, Nepal exported goods worth Rs. 210 billion.
📈 Monthly Export Trends
Exports have exceeded Rs. 30 billion for four consecutive months.
🏭 Growth in High-Value Products
Several value-added Nepali products such as tea and yarn have shown export growth.
- Dog and cat food exports increased by 36%, reaching Rs. 4 billion.
- Catechu (kathha) exports rose by 21%, reaching Rs. 2.22 billion.
- The largest contributor to the export boom, however, is refined soybean oil.
🛢️ Soybean Oil: Driving Nepal’s Export Surge
According to economist Keshav Acharya, every major spike in Nepal’s exports since 2052 BS has been largely due to vegetable ghee or oil. This year, the rise is driven mostly by refined soybean oil.
- Out of the Rs. 247 billion in total exports over 11 months, soybean oil accounted for 38%.
- Rs. 93.51 billion worth of refined soybean oil was exported during this time.
- In comparison, the same period last year saw exports of just Rs. 870 million.
Nepal imports crude soybean oil from Argentina, Brazil, Indonesia, Iraq, Thailand, and Ukraine, refines it domestically, and exports it to India.
In Bhadra 2081 (August 2024), India increased import duty on edible oil by 20%, making it costlier from other nations. However, under the Nepal-India trade treaty, Nepal’s oil exports to India enjoy zero-duty access. At least 30% value addition is required for imported raw materials to qualify.
Since Jestha 2082, India has reduced the customs duty on edible oil by 10%, but Nepali producers claim they can still compete at that rate. As of now, this change hasn’t significantly affected Nepal’s export figures.
🌻 Sunflower Oil Also on the Rise
Alongside soybean oil, refined sunflower oil exports have also surged.
- In 11 months, Nepal exported Rs. 11.33 billion worth of sunflower oil.
- In contrast, it was just Rs. 160 million during the same period last year.
Nepal imports crude sunflower oil from China, Malaysia, Spain, Vietnam, and Ukraine, refines it locally, and exports it to India.
🧵 Yarn Exports Increase
Yarn exports reached Rs. 11.62 billion over 10 months.
Meanwhile, construction material exports, which had risen sharply in previous years, have declined significantly this year.
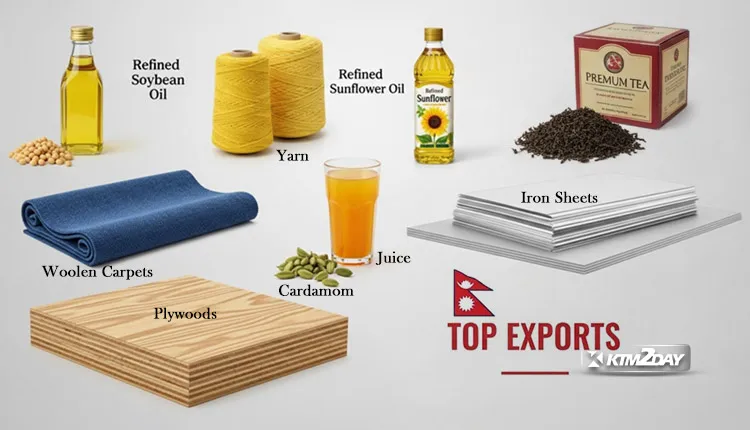
🥇 Top 15 Exported Products (Last 11 Months)
| Product | Last Year Export Value | Current Year Export Value | Growth/Decline |
|---|---|---|---|
| Refined Soybean Oil | Rs. 880 million | Rs. 93.52 billion | ↑ Rs. 92.64 billion |
| Yarn | Rs. 10.50 billion | Rs. 13.01 billion | ↑ Rs. 2.51 billion |
| Refined Sunflower Oil | Rs. 160 million | Rs. 11.34 billion | ↑ Rs. 11.18 billion |
| Woolen Carpets | Rs. 9.69 billion | Rs. 9.78 billion | ↑ Rs. 90 million |
| Iron Sheets | Rs. 10.26 billion | Rs. 9.10 billion | ↓ Rs. 1.16 billion |
| Ready-made Garments | Rs. 7.72 billion | Rs. 7.27 billion | ↓ Rs. 450 million |
| Fruit Juice | Rs. 7.93 billion | Rs. 7.25 billion | ↓ Rs. 680 million |
| Cardamom | Rs. 7.46 billion | Rs. 7.19 billion | ↓ Rs. 270 million |
| Plywood | Rs. 6.65 billion | Rs. 6.61 billion | ↓ Rs. 40 million |
| Jute Fabrics | Rs. 4.13 billion | Rs. 6.66 billion | ↑ Rs. 1.53 billion |
| Jamdani Fabric | Rs. 4.34 billion | Rs. 4.63 billion | ↑ Rs. 280 million |
| Tea | Rs. 3.16 billion | Rs. 4.20 billion | ↑ Rs. 1.04 billion |
| Dog and Cat Food | Rs. 2.93 billion | Rs. 3.99 billion | ↑ Rs. 1.07 billion |
| Pine Resin (Pina) | Rs. 2.66 billion | Rs. 3.27 billion | ↑ Rs. 610 million |
| Other Fabrics (non-wool/cotton/poly) | Rs. 2.88 billion | Rs. 2.77 billion | ↓ Rs. 110 million |
📦 Imports Also Rise
Nepal’s imports reached Rs. 1.644 trillion in 11 months — a 13% increase compared to the same period last year.
A significant portion of imports includes crude soybean oil, worth Rs. 95.72 billion, compared to Rs. 13 billion last year — showing a massive jump.


")


")
")

")


")
")

")